SVG line要素
線を描写します。
直線を描いたサンプルプログラム
<?xml version="1.0" encoding="UTF-8"?>
<pxd paper-type="a4">
<page>
<svg width="21cm" height="29.7cm" viewBox="0 0 2100 2970">
 <g stroke-width="1">
  <line x1="100" y1="200" x2="1500" y2="600" stroke="red"/>
  <line x1="150" y1="250" x2="1600" y2="500" stroke="orange"/>
  <line x1="200" y1="300" x2="1700" y2="400" stroke="yellow"/>
  <line x1="250" y1="350" x2="1800" y2="300" stroke="green"/>
  <line x1="200" y1="400" x2="1900" y2="200" stroke="blue"/>
  <line x1="150" y1="450" x2="2000" y2="100" stroke="purple"/>
 </g>
</svg>
</page>
</pxd>

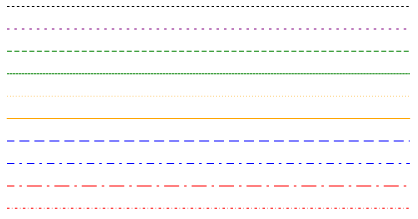
波線を描いたサンプルプログラム
<?xml version="1.0" encoding="UTF-8"?>
<pxd paper-type="a4">
<page>
<svg width="21cm" height="29.7cm" viewBox="0 0 2100 2970">
<g stroke-width="2" x1="100" x2="1900">
 <line y1="200" y2="200" stroke-dasharray="5, 5" stroke="black" />
 <line y1="300" y2="300" stroke-dasharray="5, 10" stroke="purple" />
 <line y1="400" y2="400" stroke-dasharray="10, 5" stroke="green"/>
 <line y1="500" y2="500" stroke-dasharray="5, 1" stroke="green"/>
 <line y1="600" y2="600" stroke-dasharray="1, 5" stroke="orange"/>
 <line y1="700" y2="700" stroke-dasharray="0.9" stroke="orange"/>
 <line y1="800" y2="800" stroke-dasharray="15, 10, 5" stroke="blue"/>
 <line y1="900" y2="900" stroke-dasharray="15, 10, 5, 10" stroke="blue"/>
 <line y1="1000" y2="1000" stroke-dasharray="15, 10, 5, 10, 15" stroke="red"/>
 <line y1="1100" y2="1100" stroke-dasharray="5, 5, 1, 5" stroke="red"/>
</g>
</svg>
</page>
</pxd>

line要素の主な属性
| 属性名 | 値 |
|---|---|
| x1 | 始点のX 座標 |
| x2 | 終点のX 座標 |
| y1 | 始点のY座標 |
| y2 | 終点のY座標 |
| stroke | 線の色 |
| stroke-dasharray | 線を点線にします。数値をカンマまたは空白で区切る。 例:stroke-dasharray=”10,20″ |